Financial Statements, General Ledger & Business Analytics
Generate and interpret General Ledgers, Profit & Loss Statements, Balance Sheets, Trial Balances, Stock Valuations, and Aging Reports.
Learning Objectives
By the end of this guide, you will:
- Generate and filter audited General Ledger reports with date ranges and party tags.
- Interpret the Profit & Loss Statement (P&L) to analyze gross margins and net profitability.
- Verify business solvency using the Balance Sheet.
- Conduct equilibrium audits with the Trial Balance.
- Export financial statements to Excel, CSV, and high-resolution PDF.
1. The General Ledger Report
The General Ledger is the complete chronological record of all accounting transactions posted across all accounts.
Navigate to Reports > General Ledger (or press Ctrl+K and type General Ledger):
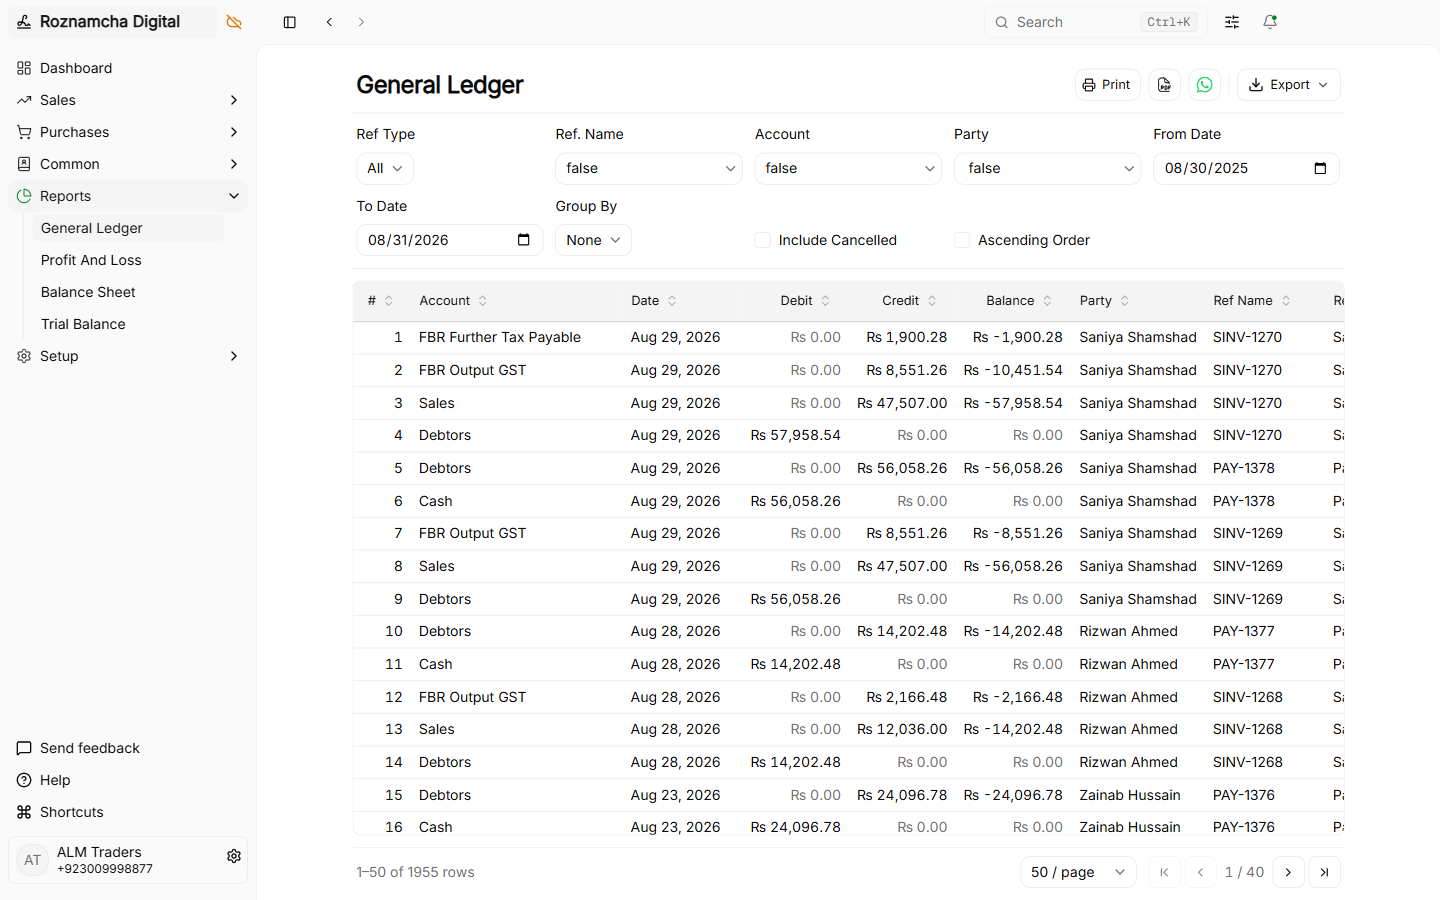
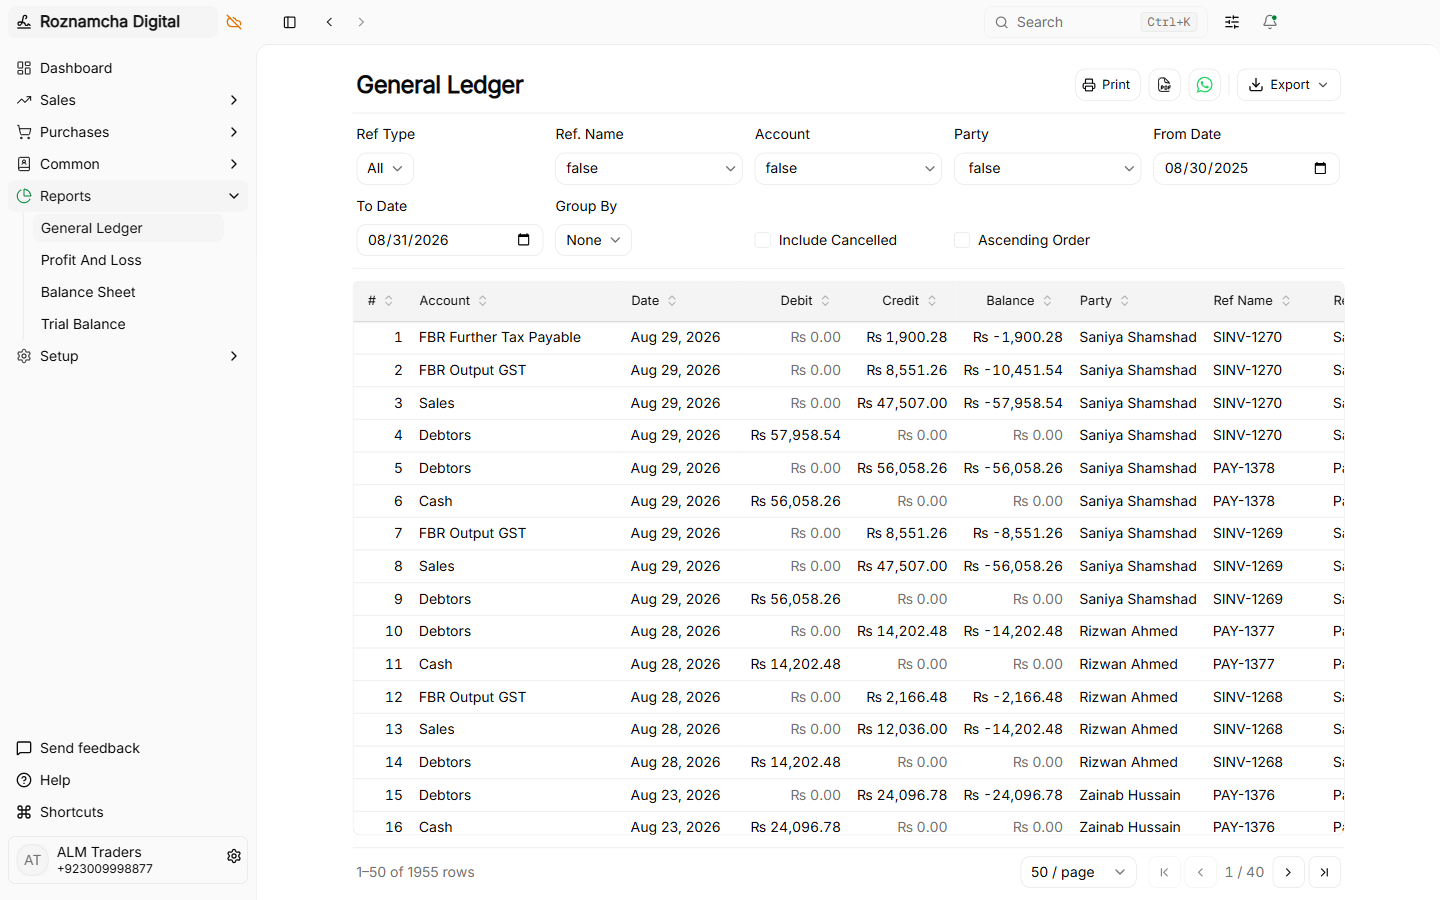
Key Features & Filters:
- Date Range: Filter by Fiscal Year, This Quarter, This Month, or Custom Date Span.
- Account Filter: View a single specific account (e.g. 1121 Meezan Bank) or view the entire ledger.
- Party Filter: View all entries involving a specific Customer or Supplier.
- Group by Reference: Combines debit and credit legs of the same transaction into a unified voucher block.
2. Profit and Loss Statement (P&L / Income Statement)
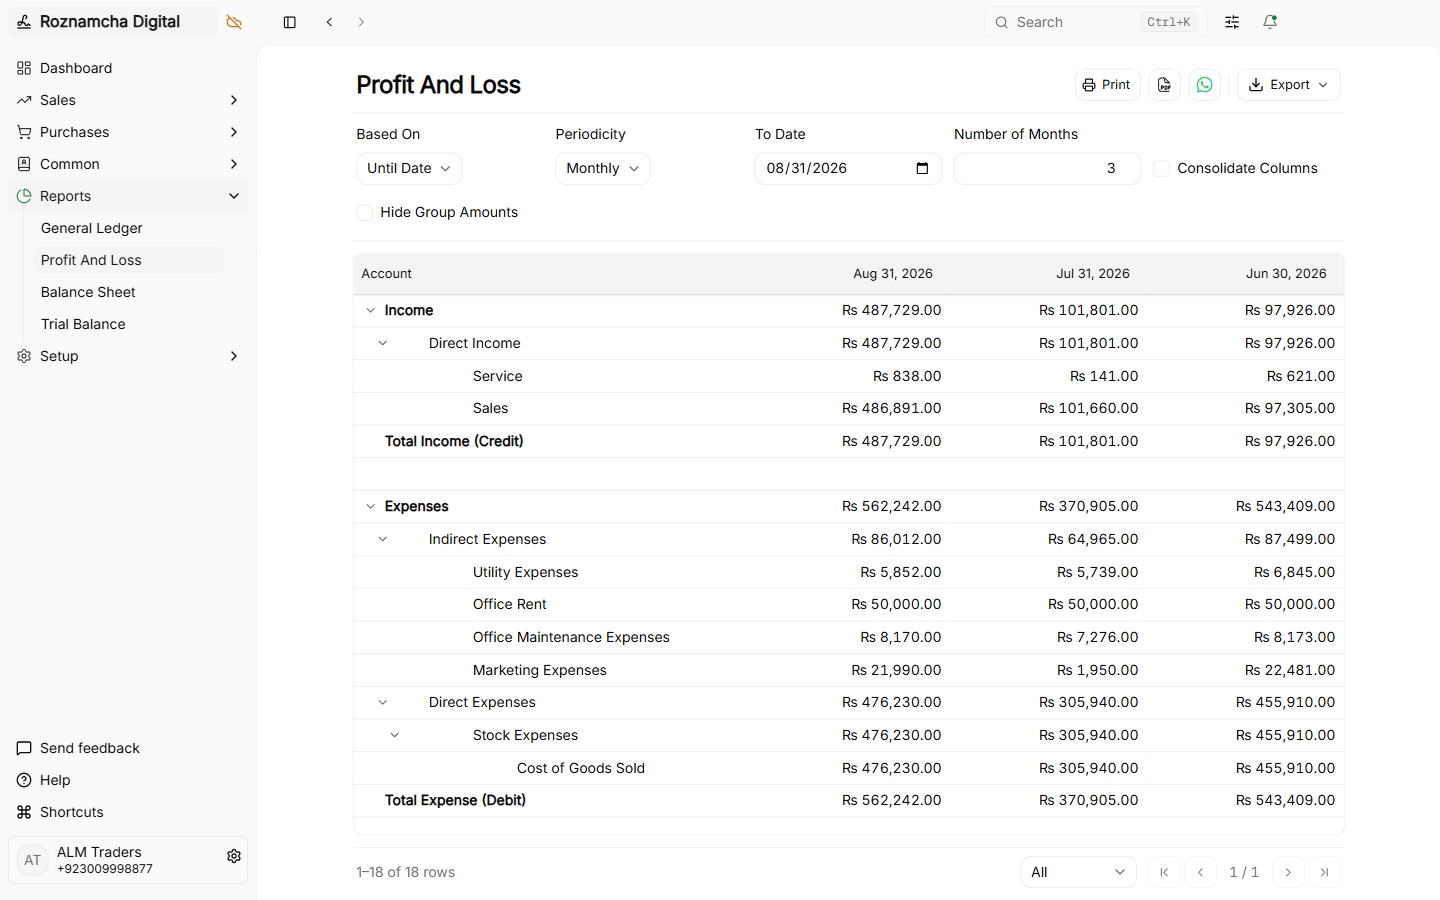
The Profit & Loss Statement measures your business's financial performance over a given period of time:
Navigate to Reports > Profit and Loss Statement:
3. The Balance Sheet
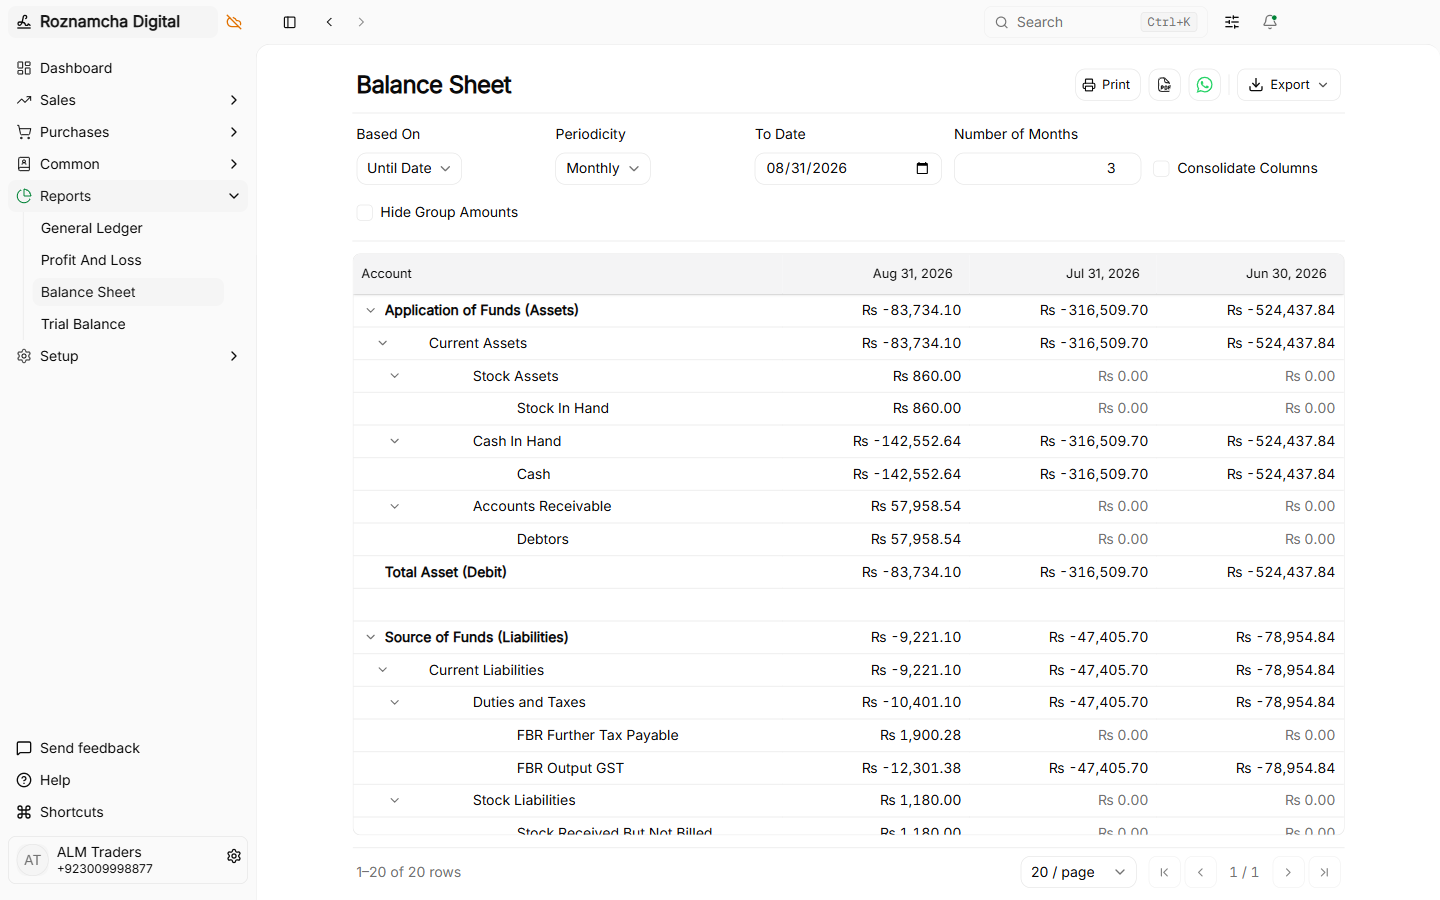
The Balance Sheet provides a financial snapshot of your company at a specific moment in time (e.g. As on June 30, 2026):
Navigate to Reports > Balance Sheet:
4. The Trial Balance
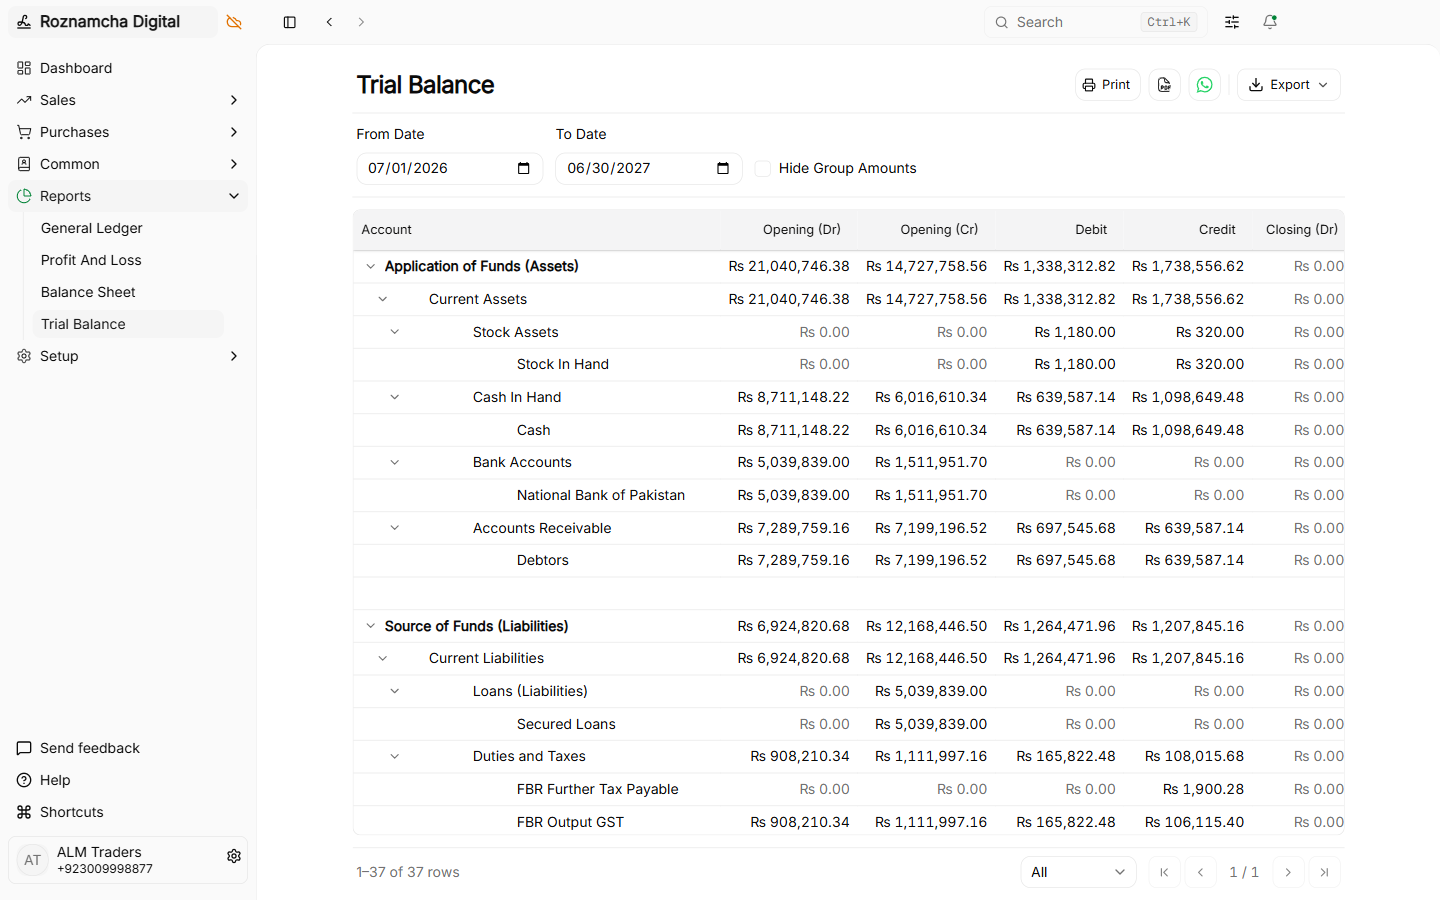
The Trial Balance lists the opening balance, period activity, and closing debit/credit balance of every active account in your Chart of Accounts to prove mathematical equilibrium:
Navigate to Reports > Trial Balance:
The 7 Report Columns
Roznamcha Digital's Trial Balance provides full period-movement visibility across 7 distinct columns:
| Column | Alignment | Definition |
|---|---|---|
Account | Left | Hierarchical account name with expandable/collapsible tree indentation. |
Opening (Dr) | Right | Debit opening balance as of the beginning of the From Date. |
Opening (Cr) | Right | Credit opening balance as of the beginning of the From Date. |
Debit | Right | Total new debit transactions posted within the selected date range. |
Credit | Right | Total new credit transactions posted within the selected date range. |
Closing (Dr) | Right | Final closing debit balance (Opening + Debit - Credit). |
Closing (Cr) | Right | Final closing credit balance (Opening + Credit - Debit). |
Interactive Tree Folding & "Hide Group Amounts" Filter
- Interactive Tree Folding: Click any root group (e.g. Current Assets) to collapse or expand its child sub-groups and leaf ledgers.
- Hide Group Amounts Toggle: Check Hide Group Amounts in the filter header to suppress rolled-up subtotals on parent group headers, leaving only discrete leaf ledger rows.
- Equilibrium Verification: At the bottom of the table, Total Debits must equal Total Credits (
Total Debits == Total Credits). Any discrepancy is flagged in red for immediate investigation. - Exporting Options: Export the full statement to CSV or generate a clean printable PDF via the top action bar.
Common Pitfalls & Best Practices
Audit Date Filters Carefully: When generating a Balance Sheet, remember that it represents a cumulative point in time, whereas the Profit & Loss Statement reflects activity within a specific date range.
Drill-Down to Source Transactions: In any report, click on any underlined figure to open the underlying General Ledger ledger rows and original invoice vouchers.
Knowledge Check
Journal Entries, Depreciation, Accruals & Month-End Closing
Post multi-account adjusting journal entries, calculate asset depreciation, manage accruals, and execute month-end financial closing.
Custom Fields, Form Layouts & Visual Print Template Designer
Customize form fields, tailor document numbering series, and build branded invoice print templates with logos, bank details, and terms.